
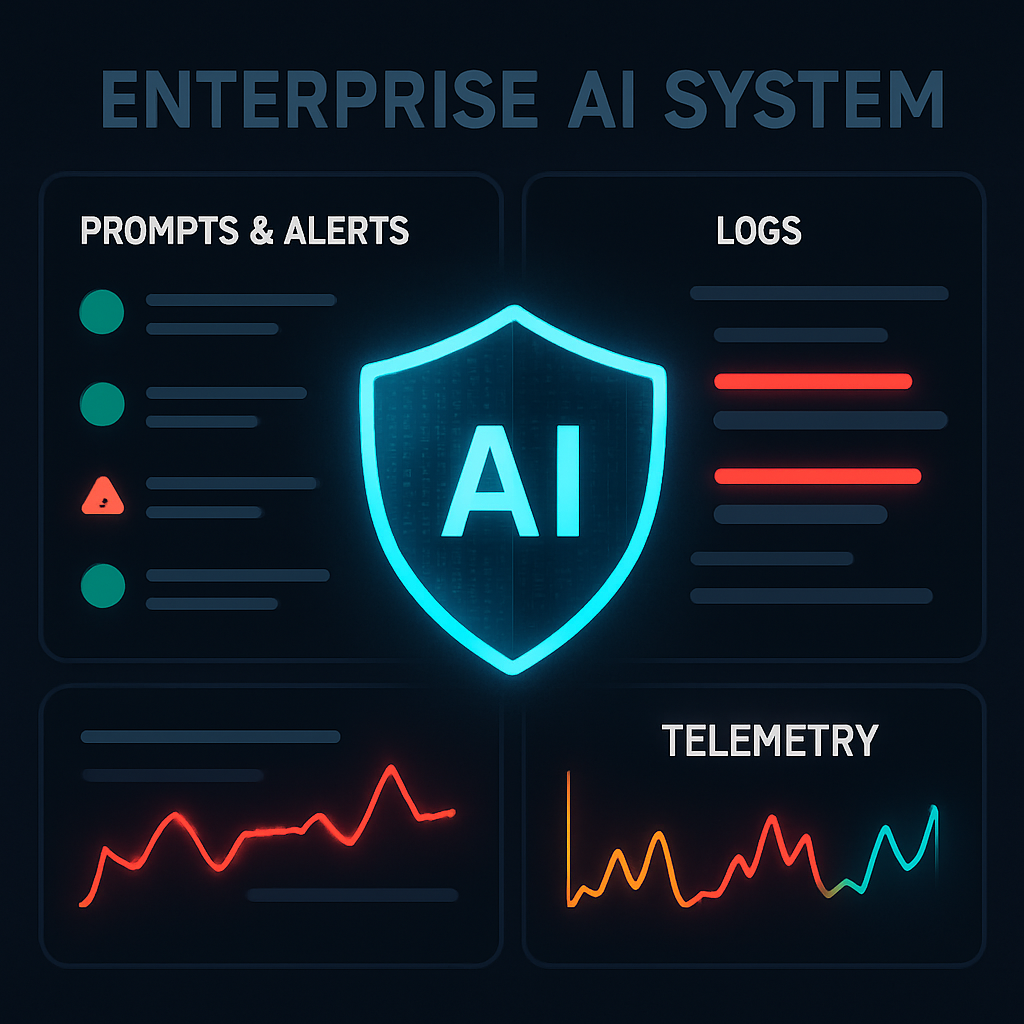
AI systems are only as trustworthy as the prompts that guide them. While most interactions are benign, a growing share are crafted to exploit model behavior, exfiltrate sensitive data, or bypass safety policies. For organizations shipping AI features, the stakes are high: brand risk, compliance exposure, degraded user experience, and operational noise. The good news is that a thoughtful mix of monitoring, alerts, and guardrails can drastically reduce these risks.
This guide explains how to detect and mitigate malicious prompts using practical telemetry, dashboards, alerting strategies, and response playbooks. It is written for a general audience seeking a professional, vendor-agnostic blueprint that can scale from a proof of concept to production.
Table of Contents
- Why Malicious Prompts Matter
- Common Types of Malicious Prompts
- Signals and Indicators to Watch
- Instrumentation and Logging
- Designing Monitoring Dashboards
- Alerting Strategy and Thresholds
- Automated Mitigations and Guardrails
- Human-in-the-Loop Response Playbooks
- Privacy, Ethics, and Compliance
- Measuring Effectiveness and Continuous Improvement
- Getting Started: A Phased Rollout
- Conclusion
- Frequently Asked Questions
Why Malicious Prompts Matter
Prompts are the primary control surface for large language models (LLMs) and other generative systems. Attackers know this and increasingly target prompts to make models reveal secrets, produce unsafe content, or execute unintended steps. Even well-meaning users can accidentally cause harm by pasting sensitive data or following unverified instructions from external sources.
Left unmonitored, these issues can lead to data leakage, policy violations, financial loss, and loss of customer trust. Monitoring and alerting are therefore not optional—they are foundational controls that convert invisible risk into visible signals your team can manage. The goal is not to block everything, but to detect early, mitigate gracefully, and learn continuously.
Common Types of Malicious Prompts
Jailbreaks and policy bypass
Attackers craft messages that persuade or coerce a model to ignore system rules. This often involves roleplay, emotional appeals, or nested instructions designed to elicit restricted output.
Prompt injection
Prompts attempt to override prior context or instructions. In RAG and tool-using systems, injections can enter via retrieved documents, URLs, or third-party data sources, telling the model to follow new, harmful instructions.
Data exfiltration
Requests aim to extract secrets in the prompt, system instructions, tool outputs, or embeddings. Telltale signs include queries for credentials, private keys, or internal system notes.
Model DoS and resource abuse
Inputs intentionally consume excessive tokens or trigger worst-case generation patterns, inflating cost and latency. Repeated long prompts, recursive tasks, or adversarial tokens are common tactics.
Obfuscation and evasion
Attackers encode instructions (e.g., base64, hex), use homoglyphs, or hide content in code fences and markup to evade simple filters.
Indirect prompt injection
Instructions are embedded in external content your system consumes (web pages, PDFs, emails). The model reads the content and unknowingly follows hostile directives.
Signals and Indicators to Watch
Good monitoring starts with clear signals. Consider a layered set of indicators across content, behavior, and system health.
- Safety policy triggers: spikes in toxicity, self-harm, hate, or violence classifiers.
- Refusal/override patterns: abnormal swings in refusal rates or policy citations.
- Structural anomalies: unusually long prompts, repeated delimiters, excessive code fences, or high symbol entropy.
- Encoded content: base64, hex, or steganographic hints in user inputs.
- Injection markers: phrases like “ignore previous instructions,” “system prompt,” or attempts to reveal hidden policies.
- Sensitive-topic probing: requests for secrets, credentials, PII, or internal URLs.
- Tool and function anomalies: atypical function call frequency, unusual parameter shapes, or out-of-policy destinations.
- Retrieval risks: retrieved documents with “do not follow policy” or hidden CSS/HTML instructions.
- Cost/latency drift: token surges, long generation tails, or sudden error bursts.
- User/account patterns: rapid-fire attempts, multiple failed sessions, or device/IP diversity consistent with probing.
Instrumentation and Logging
Effective alerts rely on high-quality telemetry. Instrument your stack from the client to the model and back.
What to capture
- Prompts and responses: raw text plus normalized forms (e.g., lowercased, stripped) for analysis.
- Token counts and costs: prompt, completion, and total tokens per request.
- Safety flags and classifier scores: toxicity, self-harm, hate, PII, and jailbreak signals.
- Function/tool traces: function names, parameters, outcomes, and errors.
- Retrieval context: document IDs, sources, and snippet hashes.
- User/session metadata: hashed user ID, tenant, channel, device, IP (minimize and hash where possible).
- Versioning: model, prompt template version, guardrail config, and release build.
Redaction and minimization
Balance visibility with privacy. Redact obvious secrets (keys, tokens, SSNs), hash identifiers, and store only what you need to detect misuse. Separate sensitive raw data from aggregated analytics.
Retention and access
Define retention windows by risk and regulation. Limit log access with role-based controls, audit access, and encrypt at rest and in transit. Keep an incident-ready export path for rapid analysis.
Designing Monitoring Dashboards
Dashboards convert telemetry into insight. Aim for clarity, trends, and drill-down capability.
- Overview: request volume, success rate, average latency, cost per request, and top models used.
- Risk panel: safety-score distributions, jailbreak rate, injection detections, and refusal trends.
- Content patterns: top n-grams in flagged prompts, most common encodings, and high-entropy input rates.
- Tooling health: function call volume, error rates, and unusual parameter distributions.
- Retrieval hygiene: sources with elevated risk, document-level flags, and outlier embeddings.
- Segmentation: breakdown by product surface, geography, tenant, and traffic source.
- Drill-throughs: click from KPI to underlying samples, with redacted views by default.
Alerting Strategy and Thresholds
Alerting should be timely, relevant, and actionable. Too much noise numbs the team; too little lets incidents slip by.
Alert types
- Static thresholds: e.g., jailbreak score >= X for Y minutes.
- Rate-based: sudden increases in flagged prompts per minute or per user.
- Anomaly detection: deviations from learned baselines for cost, latency, or safety scores.
- Composite signals: combine indicators (e.g., encoding present + injection phrase + long prompt).
Severity and routing
- Sev 1: active data exfiltration risk or widespread policy bypass. Page on-call.
- Sev 2: targeted attacks with limited impact. Notify security and product channels.
- Sev 3: exploratory probing or false-positive spikes. Create a ticket and monitor.
Reduce noise
- Dedup alerts for the same user/session within a cooldown window.
- Use minimum sample sizes and sustained durations before paging.
- Tag and suppress known benign patterns; keep an “allow with watch” list.
Automated Mitigations and Guardrails
Mitigation should be proportional and reversible. Automate safe defaults while preserving user experience.
- Prompt hardening: structured system prompts, clear refusal policies, and policy-first templates.
- Content filters: pre- and post-generation checks for unsafe categories and PII.
- Context isolation: separate system instructions from user input; avoid blind concatenation.
- Retrieval hygiene: sanitize HTML, strip hidden instructions, and limit tokens from untrusted sources.
- Rate limiting and friction: CAPTCHAs, step-up verification, or slower modes for suspicious sessions.
- Safe-mode responses: switch to stricter models or shorter outputs when risk is high.
- Function call allowlists: constrain tools, parameters, and destinations; validate inputs server-side.
- Circuit breakers: halt risky features temporarily when alerts exceed thresholds.
- Quarantine and replay: sandbox suspicious requests for offline analysis and model tuning.
Human-in-the-Loop Response Playbooks
When alerts fire, people make the difference. Prepare concise, repeatable playbooks.
- Triage: confirm signal, scope impact, and classify severity. Check dashboards and sample logs.
- Contain: enable safe-mode, rate limits, or circuit breakers. Isolate affected tenants or surfaces.
- Investigate: identify patterns, sources, and user cohorts; review retrieved documents and tool traces.
- Remediate: patch prompts and guardrails, update filters, and adjust thresholds.
- Communicate: inform stakeholders with clear, non-alarming updates; document decisions.
- Post-incident: run a blameless review, capture learnings, and update runbooks and tests.
Privacy, Ethics, and Compliance
Security and privacy go hand in hand. Monitoring should respect users while protecting them.
- Data minimization: log only what is necessary for detection and for as short a time as possible.
- Redaction and hashing: mask secrets and personally identifiable information wherever feasible.
- Access control: limit log access, enforce least privilege, and monitor for access anomalies.
- Transparency: publish clear terms about monitoring and safety measures; provide user controls where appropriate.
- Regulatory alignment: map practices to frameworks like GDPR/CCPA and audit regularly. Consider the NIST AI RMF for risk governance.
Measuring Effectiveness and Continuous Improvement
What gets measured gets improved. Track both security and product metrics to avoid overfitting on either.
- Detector performance: precision, recall, and false-positive rate for jailbreak/injection classifiers.
- Operational speed: mean time to acknowledge (MTTA) and mean time to remediate (MTTR).
- User impact: refusal accuracy, safe-mode rate, and customer satisfaction during incidents.
- Cost control: token cost per session before/after mitigations and during attack windows.
- Testing cadence: red teaming, adversarial evaluations, and automated regression tests for policies.
Getting Started: A Phased Rollout
You do not need enterprise tooling to start. Build iteratively and add sophistication as you learn.
Phase 1: Baseline
- Instrument basic logs (prompts, responses, tokens, safety flags) with redaction.
- Set up an overview dashboard and a small set of static threshold alerts.
- Create one-page playbooks for triage and containment.
Phase 2: Harden and segment
- Harden prompts, add pre/post filters, and isolate system instructions.
- Segment dashboards by product surface, tenant, and model; tune thresholds per segment.
- Add anomaly detection for cost/latency and composite risk scoring.
Phase 3: Automate and learn
- Introduce safe-mode fallbacks, rate limits, and circuit breakers tied to alerts.
- Run periodic red-team tests; feed findings back into detectors and prompts.
- Measure detector precision/recall and maintain a curated library of attack examples.
Conclusion
Malicious prompts are a predictable part of operating AI systems at scale. With the right telemetry, dashboards, alerts, and guardrails, you can transform that risk into a managed operational domain. Start with a clear set of signals, build noise-resistant alerts, automate safe responses, and keep humans in the loop for judgment calls. Over time, make improvements measurable so each incident strengthens your defenses.
The organizations that succeed will treat detection and mitigation as a continuous practice—not a one-time setup. Begin small, stay transparent, and iterate deliberately.
Frequently Asked Questions
What is the fastest way to start detecting malicious prompts?
Instrument basic logs (prompts, responses, tokens, safety flags) and set two or three high-signal alerts, such as jailbreak score spikes and encoded-content detection. Build a simple dashboard to visualize trends.
Will stricter guardrails hurt user experience?
Guardrails can be adaptive. Use risk-based controls—apply safe-mode or friction only when signals cross thresholds. Track satisfaction and refusal accuracy to balance safety and UX.
How do I handle prompt injection in retrieved documents?
Sanitize content before it reaches the model: strip hidden HTML instructions, limit tokens from untrusted sources, and use parsing rules that keep user content separate from system directives.
Do I need machine learning to detect attacks?
No. Start with rules, thresholds, and basic anomaly detection. As you collect examples, you can layer on models for higher recall and lower noise.
Leave a Reply