
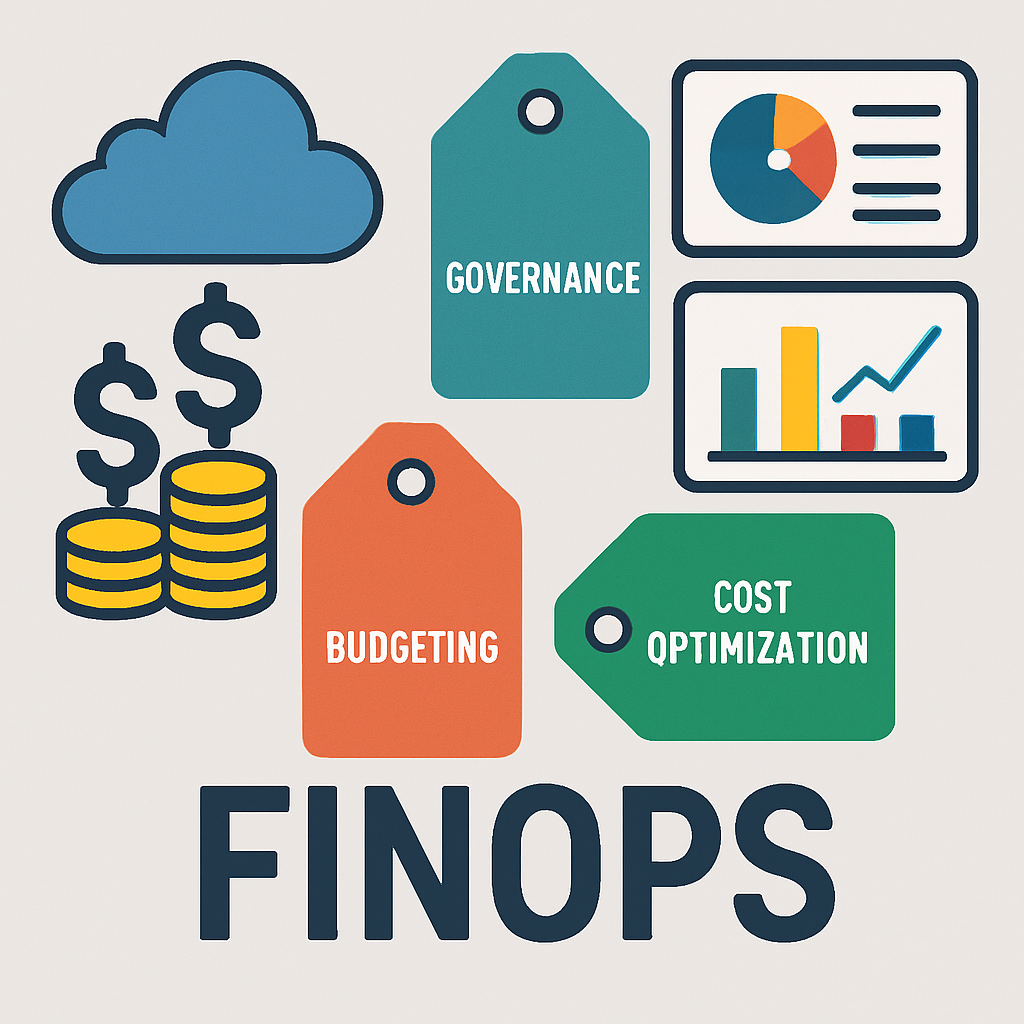
Cloud bills are nobody’s favorite surprise. Yet, when managed well, cloud spending becomes a lever for speed, reliability, and innovation. That is the promise of FinOps: aligning engineering, finance, and product to make smarter, faster, value‑driven cloud decisions.
This practical playbook focuses on three pillars you can implement immediately: a robust tagging strategy, actionable budgeting and alerts, and cost allocation models that are fair and trusted. Whether you’re starting from spreadsheets or scaling across multiple clouds and Kubernetes, you’ll find steps, templates, and pitfalls to guide your next move.
Table of Contents
- What Is FinOps and Why It Matters
- Foundational Tagging Strategy
- Budgets, Alerts, and Guardrails
- Cost Allocation Models: Showback vs Chargeback
- Unit Economics and Cost per Business Metric
- Forecasting and Variance Analysis
- Automation and Tooling in Practice
- Multi-Cloud and Container Nuances
- Governance, Roles, and Operating Cadence
- KPIs and Dashboards That Drive Action
- Common Pitfalls and How to Avoid Them
- 90-Day FinOps Action Plan
- Conclusion
- Frequently Asked Questions
What Is FinOps and Why It Matters
FinOps is a cultural and operational practice that brings Finance, Engineering, and Product together to optimize cloud value. It is not just about cutting costs; it is about spending smarter to drive outcomes like faster delivery and higher reliability per dollar.
Core principles
- Teams collaborate: Shared visibility and common metrics replace siloed views.
- Everyone takes ownership: Product and engineering own the costs they influence.
- Decisions are data‑driven: Cost, performance, and business metrics guide trade‑offs.
Business outcomes
- Predictable spend that matches growth and seasonality.
- Better unit economics and margins.
- Fewer surprises through proactive forecasting and guardrails.
Foundational Tagging Strategy
Tagging is the backbone of FinOps. Without consistent tags (or labels), you cannot allocate, optimize, or forecast confidently. Start with a minimum viable standard, enforce it, and iterate.
Minimum viable tagging (MVT)
Define a small, mandatory set that covers accountability, purpose, and funding:
- owner: team or individual responsible
- application or service: product/workload name
- environment: prod, staging, dev, test
- cost_center or business_unit: finance charge code
- project or initiative: campaign, feature, client, or epic
- optional extras: data_classification, compliance, tier
Platform specifics that matter
- AWS: standardize resource tags and enable cost allocation tags in billing; propagate tags via Infrastructure as Code.
- Azure: use tags at resource/resource group levels; standardize subscription purpose with naming and policy.
- GCP: prefer labels and project hierarchy (folders, org); consider cost categories via BigQuery exports.
Governance and hygiene
- Make MVT tags non‑negotiable for production resources.
- Enforce with policies (e.g., deny create if missing tags; remediate with automation for drift).
- Validate with CI/CD checks and IaC modules that inject required tags.
- Audit monthly: target >95% tag coverage by spend; track exceptions.
- Provide a tag dictionary with definitions, allowed values, and examples.
Budgets, Alerts, and Guardrails
Budgets translate strategy into action. They set expectations, trigger conversations early, and protect margins.
Budget scopes
- Account/subscription/project: baseline controls and anomaly alerts.
- Product or service: the unit teams can influence; alerts to team channels.
- Environment: prod vs non‑prod to highlight waste and sandbox growth.
Alert design
- Thresholds: 50%, 80%, 100% of budget; add forecast‑to‑exceed alerts.
- Route alerts to the owners tag via chat or ticket; auto‑create tasks.
- Include context: current burn rate, top services, last 7/30 day trend.
Guardrails that work
- Non‑prod spend caps with soft blocks and whitelisted exceptions.
- Auto‑shutdown policies for idle dev/test resources after hours.
- Pre‑deployment checks for unusually large instance types or untagged assets.
Cost Allocation Models: Showback vs Chargeback
Allocation builds trust. When people believe the bill is accurate and fair, they engage. Choose a model that reflects your culture and maturity.
Showback
Showback reports costs to teams without internal billing. It is ideal to start quickly, establish transparency, and socialize metrics without friction.
Chargeback
Chargeback bills teams (or P&Ls) for consumption. It encourages accountability and prioritization but requires reliable data, executive sponsorship, and clear dispute resolution.
Shared and unallocatable costs
- Direct costs: allocate by tag/label or dedicated accounts/projects.
- Shared platforms (e.g., networking, security tooling): spread using allocation keys such as CPU hours, storage GB, requests, or team headcount.
- Enterprise commitments (e.g., savings plans, credits): distribute proportionally to usage or benefit received.
- Document the allocation policy and revisit quarterly.
Unit Economics and Cost per Business Metric
Unit economics connect cloud spend to value. Instead of asking why the bill went up, you ask how cost per unit changed and why.
Pick meaningful units
- Consumer apps: monthly active users, sessions, or media minutes.
- Commerce: orders, checkouts, or gross merchandise volume.
- APIs: requests, GB transferred, or compute minutes.
Define the formula
Cost per unit = (Allocated product cost + proportional shared cost) / business units delivered in the same period.
Example: If Checkout Service costs $120k/month including shared allocations and processes 6M checkouts, the cost per checkout is $0.02. Improvement work should aim to lower this without harming reliability or speed.
Use cases
- Price and margin analysis by tier or region.
- Product trade‑offs: caching vs database reads, compression vs egress.
- Capacity planning tied to growth drivers.
Forecasting and Variance Analysis
Forecasts create alignment; variance analysis creates learning. Use both.
Forecasting methods
- Bottom‑up: multiply unit cost by planned business volume; add baseline shared services and buffer.
- Top‑down: extrapolate from historical run‑rate with seasonality and program adjustments.
- Commitment‑aware forecasts: model savings plan/RI coverage and utilization, plus spot adoption.
Variance taxonomy
- Rate: price per resource changed (e.g., discount, commitment coverage).
- Usage: you used more or less of the same thing.
- Mix: composition shifted (e.g., more GPU, less CPU).
Every monthly review should tag variances with this taxonomy and assign an owner and action where relevant.
Automation and Tooling in Practice
Automation enforces guardrails and removes toil. Your goal is a low‑latency feedback loop from spend to action.
Data pipeline
- Ingest provider cost exports into a data store (e.g., data warehouse).
- Standardize dimensions: account/project, service, tag set, region, purchase option.
- Enrich with business mappings (team hierarchy, product catalog, cost centers).
Automation library
- Rightsizing recommendations applied via change windows and tickets.
- Scheduled stop/start for development resources.
- Lifecycle policies: delete unattached volumes, old snapshots, idle load balancers.
- Anomaly detection: alert on unusual spend spikes with context and rollback links.
- Pre‑merge checks in CI to flag costly patterns before deployment.
Multi-Cloud and Container Nuances
Multi‑cloud and Kubernetes add power and complexity. Normalize early to keep clarity.
Normalize labels and hierarchies
- Adopt a cross‑cloud tag dictionary mapping (e.g., owner, service, env) to each provider’s construct.
- Use folders/management groups to separate prod vs non‑prod and business units.
Kubernetes cost allocation
- Attribute costs by namespace, label, controller, and workload.
- Include cluster overhead and shared add‑ons proportionally (CPU/Memory requests or usage).
- Expose cost per pod, per team, and per service in dashboards; align to unit metrics.
Network, storage, and serverless gotchas
- Egress can dominate multi‑region or multi‑cloud designs; measure and set alerts.
- Object storage lifecycle rules can halve long‑tail costs; monitor retrieval fees.
- Serverless scales beautifully but can hide expensive patterns (chatty functions, N+1 queries); profile regularly.
Governance, Roles, and Operating Cadence
FinOps thrives with clear roles and a predictable cadence. Keep meetings short and outcomes concrete.
Who does what
- FinOps lead: standards, reporting, facilitation, and enablement.
- Engineering owners: remediate waste, plan capacity, and optimize architecture.
- Finance partner: budgets, accruals, and investment modeling.
- Product manager: prioritize cost vs capability trade‑offs.
Cadence
- Weekly: anomalies, top opportunities, upcoming deployments with cost risk.
- Monthly: budget vs actuals, variance taxonomy, unit economics, commitments review.
- Quarterly: allocation policy, KPI targets, architectural bets, and contract renewals.
KPIs and Dashboards That Drive Action
Dashboards should tell you what to do next. Avoid vanity metrics; focus on levers.
Essential KPIs
- Tag coverage by spend: target >95%.
- Budget adherence: variance within ±5% at product level.
- Allocation rate: % of spend assigned to owners; target >98%.
- Commitment coverage and utilization: both >85% for stable workloads.
- Waste reduction: idle/over‑provisioned spend reclaimed month over month.
- Cost per unit vs target: trend and gap to goal.
- Anomaly MTTR: median time to detect and resolve spend spikes.
Dashboard best practices
- Separate executive views (trends, targets) from operator views (actions, owners).
- Use consistent time windows (7, 30, 90 days) and definitions.
- Highlight top three actions with owners and due dates.
Common Pitfalls and How to Avoid Them
- Boiling the ocean: Start with the top 5 products by spend and a small tag set. Expand after wins.
- Policing without enablement: Pair guardrails with templates, IaC modules, and office hours.
- Perfect allocation obsession: 95% accuracy now beats 100% in six months. Document assumptions.
- Ignoring shared costs: Define an allocation key and review quarterly.
- KPIs without ownership: Every metric must have an owner and an action path.
90-Day FinOps Action Plan
Days 0–30: Lay the foundation
- Publish the MVT tag dictionary and IaC examples; enforce in non‑prod.
- Stand up a basic dashboard: spend by product, env, owner; tag coverage; anomalies.
- Set budgets and alerts for top 5 products and all non‑prod accounts/projects.
Days 31–60: Allocate and automate
- Adopt showback with a clear allocation policy for shared costs.
- Automate two wins: idle resource cleanup and scheduled stop/start.
- Kick off commitment optimization for stable workloads.
Days 61–90: Optimize and institutionalize
- Introduce cost per unit for 1–2 critical products; socialize the metric.
- Host monthly variance reviews with rate/usage/mix taxonomy.
- Document your operating cadence; define targets for KPIs and owners.
Conclusion
FinOps turns cloud from a line item into a strategic advantage. With disciplined tagging, real budgets and alerts, and fair cost allocation, you unlock meaningful unit economics and faster, better decisions. Start small, automate where it hurts, and keep a steady cadence of review and improvement.
Takeaway: Pick three moves this week—publish your tag dictionary, set budgets for your top products, and stand up a simple showback. Momentum beats perfection.
Frequently Asked Questions
Do we need an expensive tool to start FinOps?
No. Begin with your cloud provider’s cost export, a data spreadsheet or warehouse, and a simple dashboard. Tools help at scale, but process and ownership come first.
How do we handle costs that cannot be tagged?
Use structural boundaries (separate accounts/projects) where possible. For residual shared costs, allocate by fair keys like CPU hours, storage GB, or request volume, and document the policy.
What if teams resist chargeback?
Start with showback to build trust. Pilot chargeback with a willing team, keep dispute windows short, and ensure dashboards are transparent and timely.
How often should we revisit unit metrics?
Quarterly at minimum, or when business models, architecture, or pricing change. Units must reflect value; adjust as products and customers evolve.
Leave a Reply